


The Five-Minute Demo Hides the Real Question
Getting an open model to talk back takes about five minutes. Pull meta-llama/Llama-3.1-8B-Instruct, run vllm serve, send a request, watch it answer. That part is genuinely easy, and it tells you almost nothing about whether the thing survives contact with real traffic.
The two questions that actually matter tend to show up later, usually at 2 a.m., usually as a page. How many people can this one GPU actually serve at once? And why did the server just fall over with an out-of-memory (OOM) error when nothing about the request looked unusual?
Neither question is a guess. Both come down to one memory calculation you work out once per model, plus a handful of flags that all draw from the same pool of GPU memory in different directions. Once you know that pool and which way each flag pushes it, sizing a vLLM deployment stops being trial and error and starts being arithmetic.
This is the walkthrough I wish someone had handed me before my first production deploy.
Every Request Has Two Phases, and they Compete for Different Resources
Before the memory math, it helps to pull apart what actually happens when vLLM handles a request. Every request runs through two distinct phases, and they load the GPU in opposite ways.
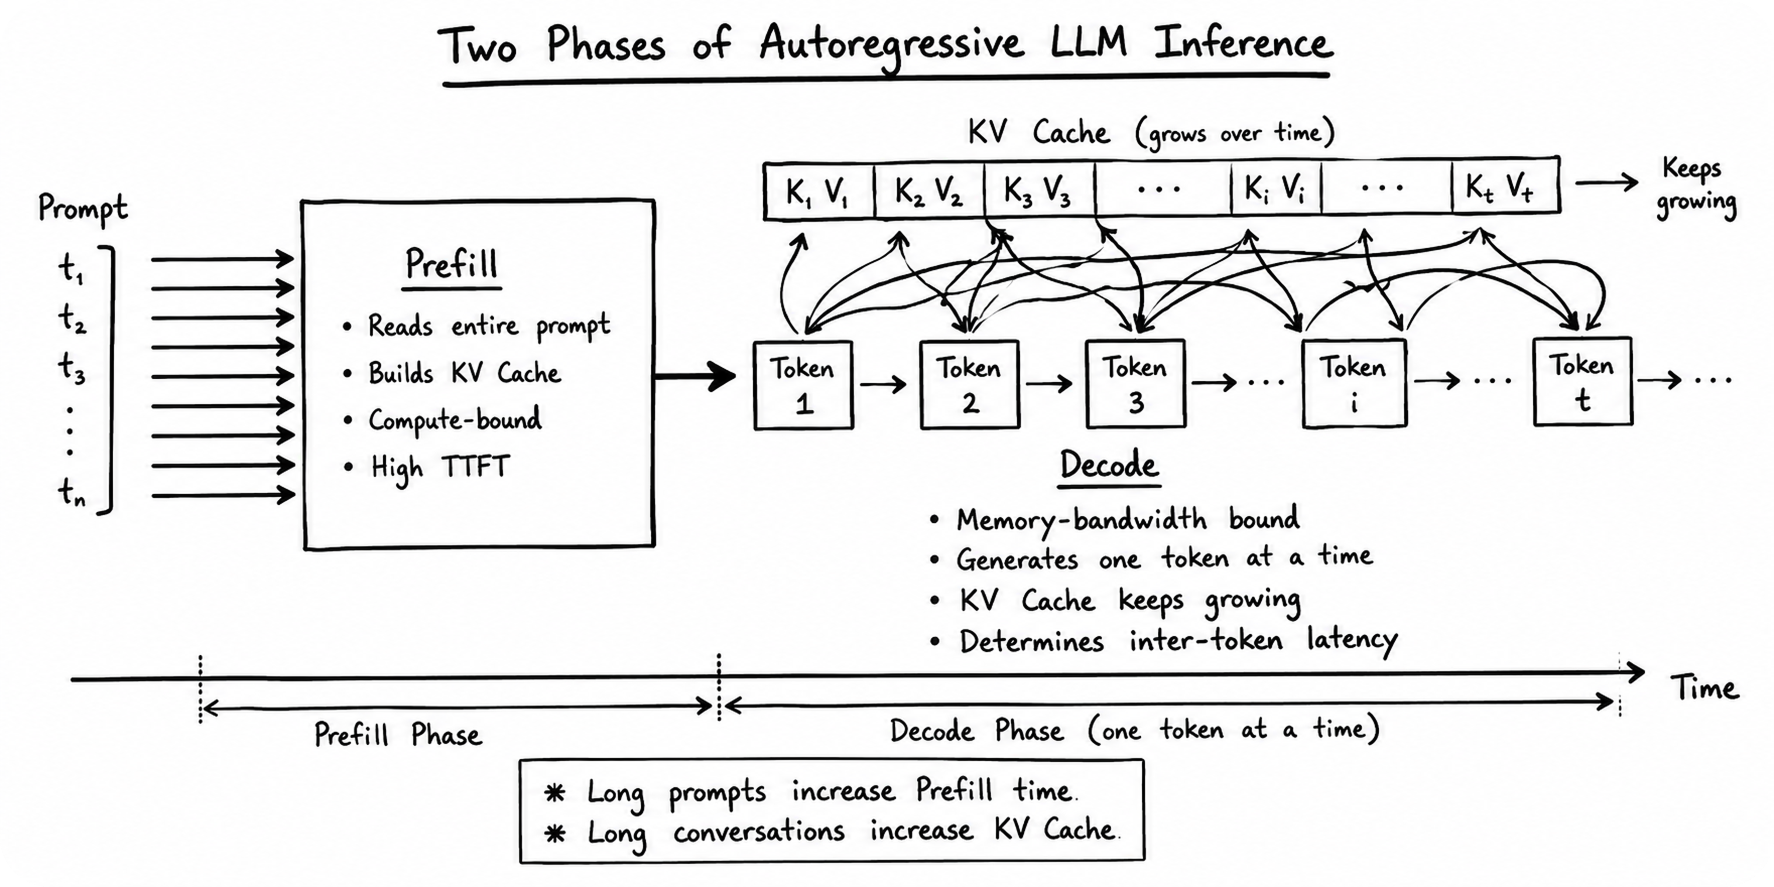
Prefill comes first. The engine reads the whole prompt in a single pass and builds the initial KV cache from it. It’s compute-heavy, dense matrix multiplication across every prompt token at once, and it’s what sets your time-to-first-token (TTFT). A long prompt means a long prefill, and a long prefill means the user waits longer before the first word shows up.
Decode comes after. The engine writes one token at a time, and for each new token it reads back through the entire KV cache built so far. This phase is bound by memory bandwidth rather than compute, the GPU spends most of its cycles moving cached keys and values rather than doing fresh math. Decode sets inter-token latency, the gap between each streamed word, and it’s the phase that keeps the cache growing for as long as generation continues. Pope et al. work this out from first principles, deriving the arithmetic intensity of each phase and showing that the memory time of loading the KV cache is what dominates decode at long context.[8]
NoteSpecifically, prefill is usually compute-bound, meaning it’s limited by how fast the GPU can do math. Decode is usually memory-bandwidth-bound, meaning it’s limited by how fast the GPU can move data around.
Long prompts mostly hurt time-to-first-token. Long conversations mostly consume GPU memory. They’re different costs, charged at different times, for different reasons, and mixing them up is a common source of confusion the first time someone tunes a vLLM deployment.
Everything from here on is about the resource decode competes for, i.e., the KV cache.
The KV Cache: The One Number that Decides Capacity
A model writes text one token at a time, and to produce the next token it has to attend back across every token that came before it. Recomputing that attention from scratch at every step would waste an enormous amount of work, since almost none of the earlier tokens have changed. So the engine saves the keys and values it already worked out and reuses them on every later step. That saved state is the KV cache, and it is the single biggest lever on how many concurrent users a GPU can serve.
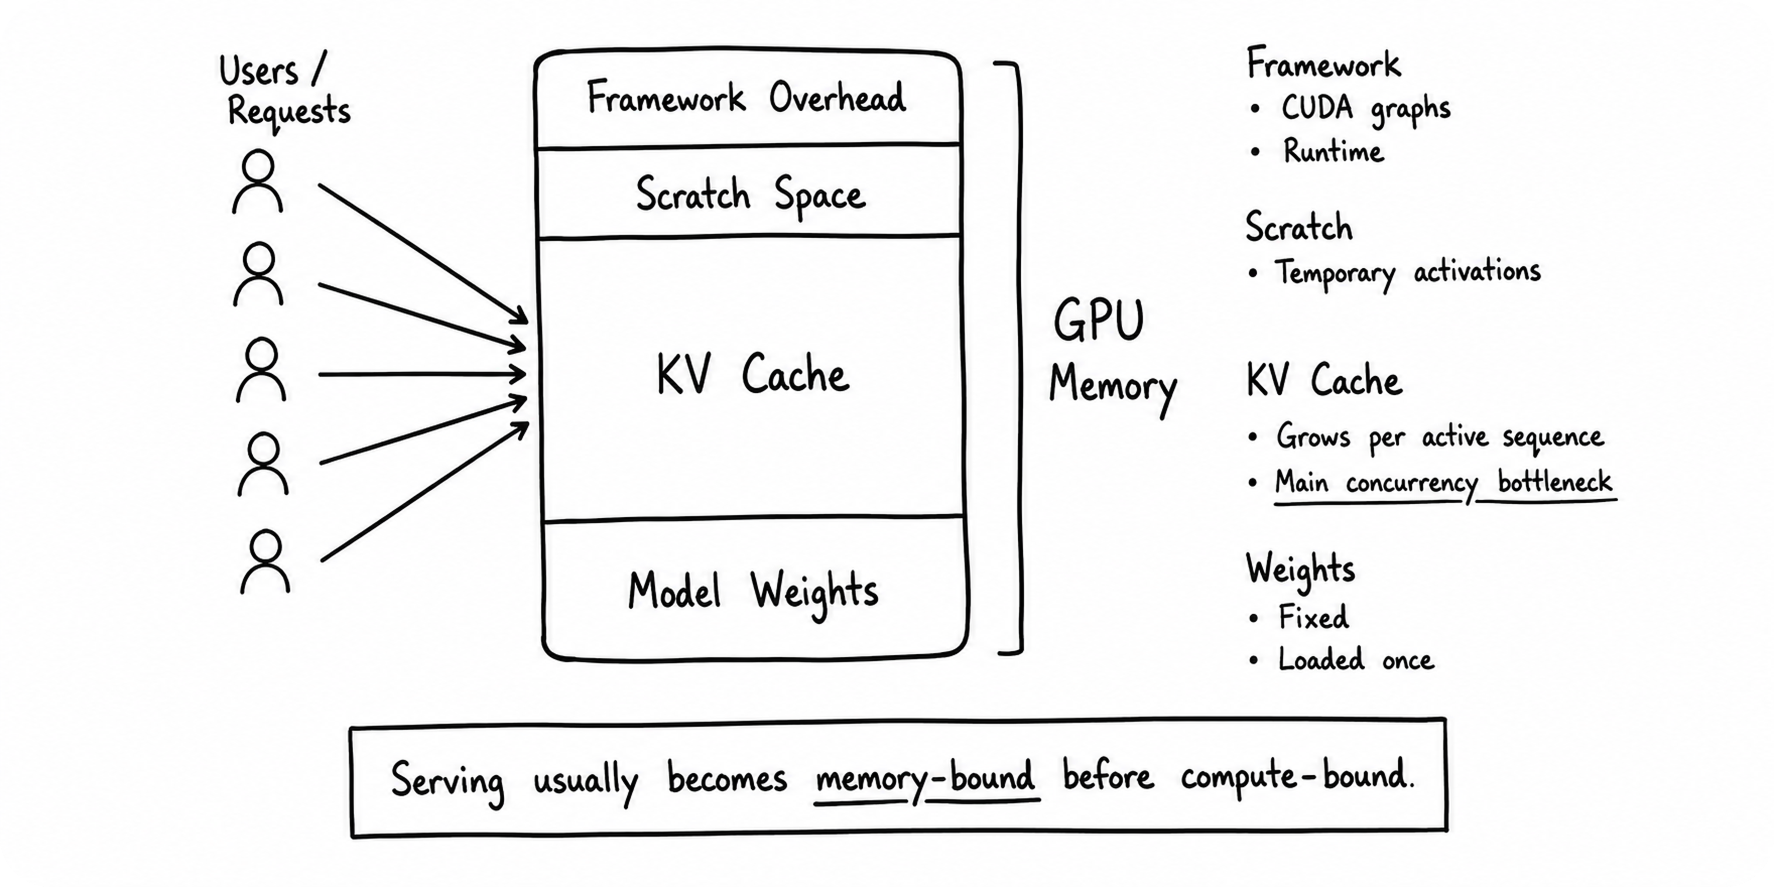
Model weights are a one-time cost, loaded once and left untouched for the life of the server. The KV cache runs the opposite way. Every active sequence adds to it, and it keeps growing for as long as that sequence keeps generating. Serving is a memory problem before it’s a speed problem, full stop. A fast GPU can sit mostly idle simply because it ran out of room to hold state for more users, long before it ran out of raw compute.
The Formula
Here’s the calculation for how much memory one token costs across the whole model, for a single sequence:
$$\text{bytes\_per\_token} = 2 \times L \times H_{kv} \times D \times B$$Where:
- $L$ is the number of transformer layers in the model.
- $H_{kv}$ is the number of key-value heads defined by GQA, i.e., grouped-query attention, not the total number of attention heads.[2] More on why that distinction matters below.
- $D$ is the head dimension, the size of each individual attention head. Read
head_dimstraight from the model’sconfig.jsonwhen it’s there, and only fall back to hidden size divided by the number of attention heads when it isn’t. Several recent architectures, Gemma 3 among them, set the head dimension independently of that ratio, and assuming the division holds will quietly give you the wrong per-token cost.[16] - $B$ is bytes per element for whatever dtype the cache is stored in. FP16 and BF16 use 2 bytes. FP8 uses 1 byte.
- The leading 2 accounts for storing two separate tensors per layer per token: the key vector and the value vector.
That formula gives you the cost of one token. Stretch it across an entire sequence and the total KV cache for a sequence of length $T$ is just:
$$\text{KV\_cache}(T) = T \times \text{bytes\_per\_token}$$Every growth example later in this piece is nothing more than this equation evaluated at a different $T$.
WarningThis applies to standard multi-head and grouped-query attention, where every layer attends to the full sequence. Llama and Qwen are the safe reference points here. DeepSeek’s Multi-head Latent Attention, introduced in DeepSeek-V2, projects queries, keys, and values into a much smaller latent vector instead of caching full per-head keys and values, and its authors report cutting KV cache size by more than 90 percent compared to a same-quality standard-attention baseline.[3] None of that runs through the formula above.
Sliding-window and hybrid-attention models break the other equation, the per-sequence one. When a layer only attends to the last $W$ tokens, its cache stops growing once the sequence passes $W$ and holds at $\min(T, W)$ tokens instead of $T$. Gemma 3, Mistral, gpt-oss, and Qwen3-Next all do some version of this, usually interleaving windowed layers with a few full-attention ones, so the real footprint is a per-layer sum rather than one multiplication. Gemma 3’s own report is explicit that shifting the local-to-global layer ratio and shortening the local span was done specifically to hold KV cache growth down at 128K context.[16] Assuming linear growth there overestimates your per-sequence cost precisely in the long-context regime this piece spends most of its time on.
If you’re sizing either kind of model, go find that architecture’s own numbers instead of reusing this one.
Why the Formula Uses KV Heads, Not Attention Heads
Without grouped-query attention, every attention head computes and stores its own separate keys and values, and $H_{kv}$ just equals the total head count. On a model with 32 or 64 heads, that adds up fast.
GQA breaks that link by letting several query heads share one small set of key-value heads. It sits between full multi-head attention and multi-query attention, which collapses every query head onto a single shared key-value head and was proposed for exactly this reason: cutting the memory bandwidth incremental decoding has to move.[9] GQA keeps most of that saving without multi-query’s quality cost.
 Llama 3.1 8B runs 32 query heads against just 8 KV heads, a 4-to-1 grouping.[4] Queries stay expressive, but the tensors that actually get cached shrink by that same factor of four. It’s the single biggest reason KV cache footprints have dropped across recent model generations, and it’s why $H_{kv}$, not total head count, is the number that belongs in the formula.
A Worked Example: Llama 3.1 8B in FP16
Llama 3.1 8B has 32 layers, 8 KV heads, and a head dimension of 128. In FP16, each element costs 2 bytes.
$$2 \times 32 \times 8 \times 128 \times 2 = 131{,}072 \text{ bytes} = 128 \text{ KiB per token}$$128 KiB is your basic unit of GPU memory consumption. Every token, in every active sequence, costs roughly that much. Run the per-sequence formula above at $T = 2,000$ and a single request holds exactly 250 MiB of KV cache for its entire lifetime. Multiply by however many sequences are active and you have your total demand at any given moment.
NoteFor those not familiar with
KiB, it stands for Kibibyte, and it’s equal to 2^10 i.e., 1024 bytes, as opposed toKBwhich is equal to 1000 bytes. 1 kilobyte is just 1000 bytes and not 1024 bytes!
The Cache Grows While the Model Is Still Talking
It’s tempting to assume only the prompt occupies KV cache and that generation itself is free. It isn’t. Every generated token gets appended to the same cache the prompt tokens landed in.
1,000 tokens
+500 tokens
+500 tokens
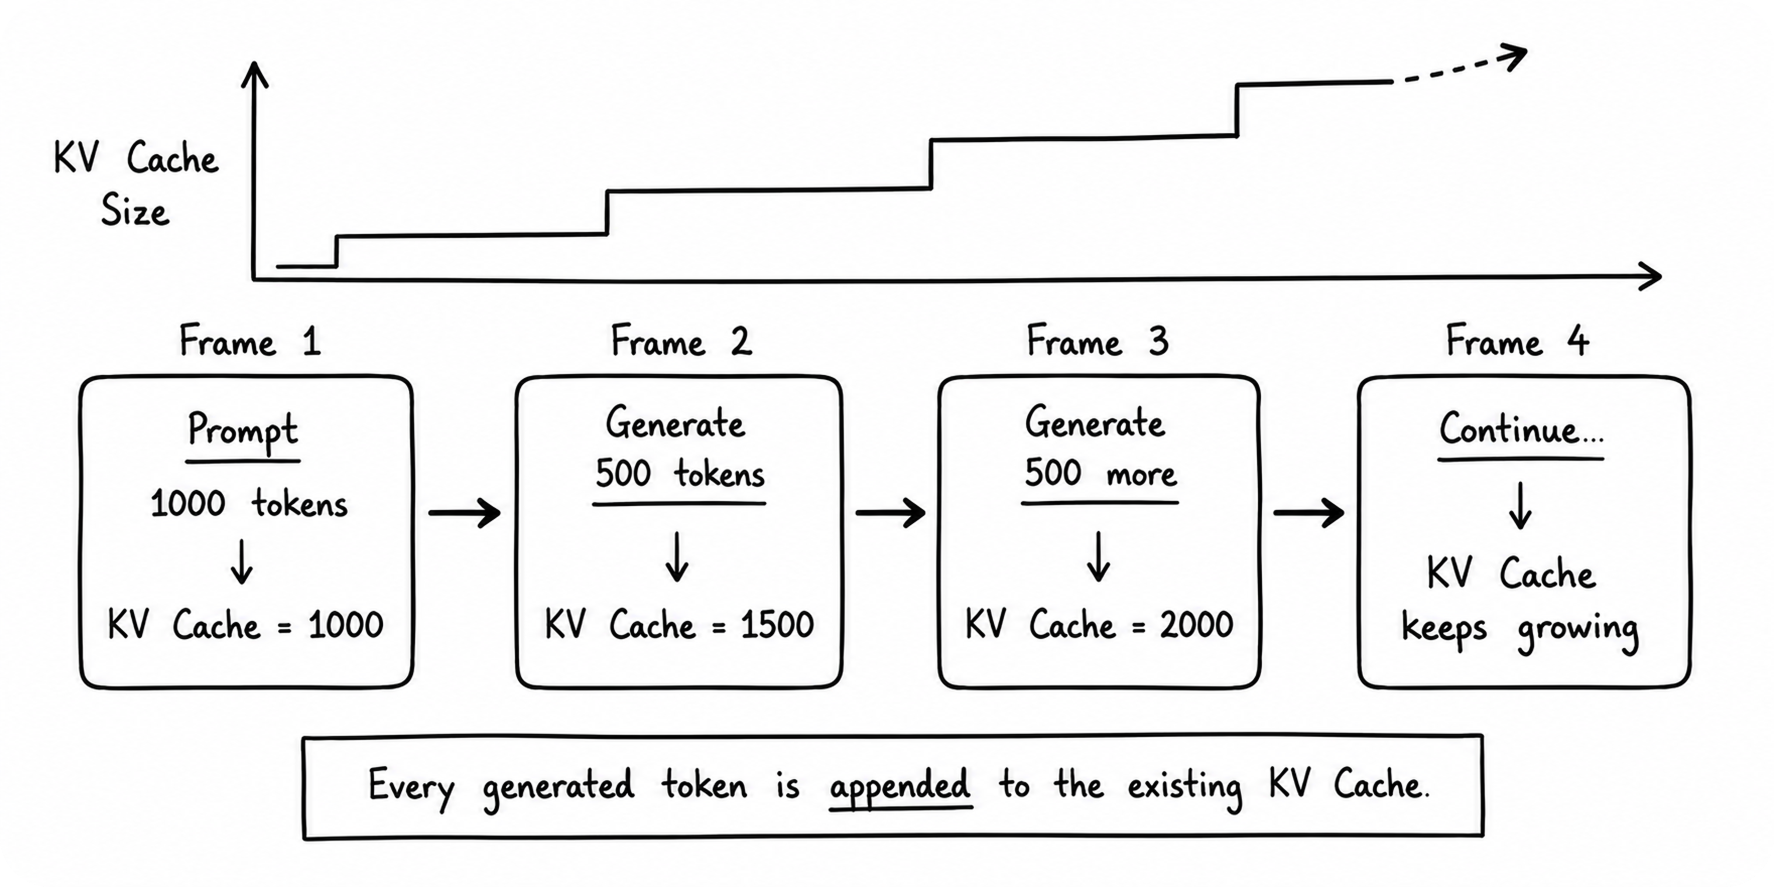
Average completion length matters just as much as average prompt length here. A chat product where people paste short prompts but get long, detailed answers back will burn through more KV cache per conversation than the prompt length alone suggests.
PagedAttention: How vLLM Actually Stores This Memory
None of the math above holds up if the KV cache has to live in one contiguous allocation per sequence, which is how early inference engines actually did it. Sequences finish at different times and different lengths, and constantly allocating and freeing large contiguous chunks fragments GPU memory, wasting capacity on gaps nothing else can fill.
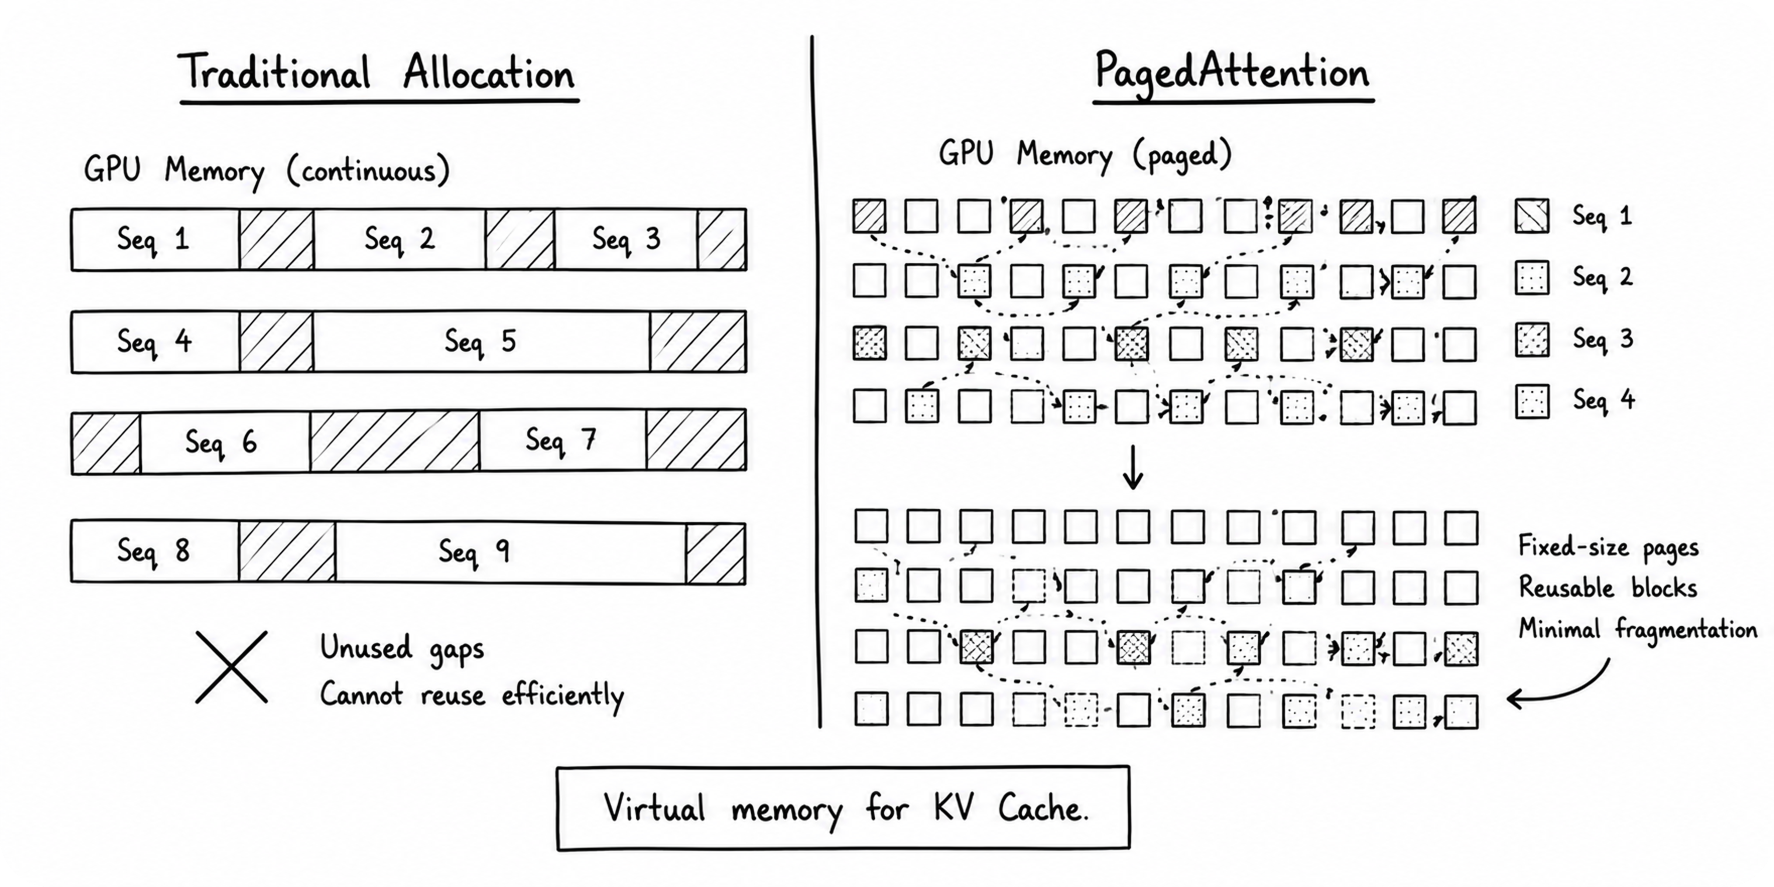
PagedAttention is the mechanism vLLM was originally built around to fix exactly this.[1] Instead of one contiguous allocation per sequence, the cache is split into small fixed-size blocks, 16 tokens each by default, and handed out to sequences wherever free blocks happen to sit in GPU memory, the same idea operating systems use for virtual memory paging. When a sequence finishes, its blocks return to the free pool immediately.
That block structure means the real capacity number is slightly less clean than the pure division suggests. The budget gets carved into whole blocks first:
$$\text{total\_blocks} = \left\lfloor \frac{\text{KV cache budget}}{\text{block\_size} \times \text{bytes\_per\_token}} \right\rfloor$$and each sequence rounds its own usage up to the nearest full block. A sequence sitting at 1,001 tokens still reserves a 63-block allocation, 1,008 tokens’ worth, wasting seven tokens of headroom in that last block. With a 16-token block size that’s at most 15 wasted tokens per sequence, small enough to ignore for capacity planning. It only starts to matter if you’re reconciling the exact token count vLLM prints in its startup logs against the back-of-envelope math above and the two don’t line up to the last decimal.
The original paper reports that this fine-grained block allocation nearly eliminates fragmentation waste in the KV cache, which is the whole reason the arithmetic above holds up about as well in production as it does on paper.[1] Because memory allocates in small blocks instead of large contiguous chunks, vLLM packs far more concurrent sequences onto one GPU than a naive allocator would allow.
What Actually Fills the GPU
GPU memory during serving splits into five pieces, four that vLLM spends and one it’s told not to touch:
$$\underbrace{\text{weights} + \text{scratch} + \text{overhead} + \text{KV cache}}_{\text{utilization} \,\times\, \text{GPU total}} \;+\; \text{reserved} \;=\; \text{GPU total}$$That last term is the slice --gpu-memory-utilization holds back. At the 0.9 default it’s a tenth of the card, sitting idle on purpose.
Weights themselves follow their own small formula:
$$\text{weights\_bytes} = N_{params} \times B_w$$where $N_{params}$ is the parameter count and $B_w$ is bytes per parameter: 2 for FP16 or BF16, 1 for FP8, roughly 0.5 for INT4. This is the number that shrinks when you quantize weights, and it draws from a completely different pool than the KV cache number above.
vLLM’s --gpu-memory-utilization flag, 0.9 by default in most recent releases though this has moved slightly across versions and is worth confirming against whatever you’re running, sets the ceiling on how much of the card vLLM may touch at all. Inside that ceiling vLLM loads the weights, profiles how much scratch space it needs for activations and CUDA graphs, and hands whatever’s left to the KV cache. You never set the KV cache size directly. It falls out of everything else.
Weight Quantization is a Different Lever Than KV Cache Quantization
The weight math above assumed FP16, 2 bytes per parameter. Plenty of production deployments don’t run FP16 weights at all. AWQ,[12] GPTQ,[13] FP8, and INT4 all shrink $B_w$ substantially, sometimes down to a quarter of its original size or less.
ImportantQuantizing your weights does nothing to your KV cache. They’re separate pools controlled by separate flags. Take an 8B model’s weights from roughly 16 GB in FP16 down to 4 GB with INT4 and that freed 12 GB flows straight into the KV budget, since it’s no longer spoken for by weights. But the cache itself sits at whatever precision
--kv-cache-dtypespecifies, FP16 by default, still 128 KiB per token, until you separately quantize it too. Two different flags, two different problems, and conflating them is one of the more common sizing mistakes I’ve watched people make.
| Format | What it typically applies to | Typical size reduction | Notes |
|---|---|---|---|
| FP16 / BF16 | Weights, KV cache (default) | Baseline | 2 bytes per element |
| FP8 | Weights or KV cache | Roughly 2x versus FP16 | Widely supported on H100 and newer. Confirm hardware support before assuming a throughput gain, not just a memory gain |
| AWQ / GPTQ | Weights only | Roughly 4x versus FP16 | Post-training quantization for weights, doesn’t touch the KV cache |
| INT4 | Weights, sometimes KV cache | Roughly 4x versus FP16 | Larger accuracy risk, workload-dependent |
Sizing a Real GPU: H100 80GB Running Llama 3.1 8B
Put the pieces on real hardware. An  H100 with 80 GB running Llama 3.1 8B in FP16:
That 52 GiB is the memory budget every active sequence draws its KV cache from. It isn’t something you configure, it’s what’s left once weights and overhead come out of the utilization ceiling.
The round figures in that breakdown are deliberate. An H100 80GB actually reports about 79.6 GiB, and 8.03B parameters at 2 bytes land at 14.96 GiB rather than a clean 16, so the two roundings largely cancel and the budget really does come out near 52 GiB. Everything below stays in binary units, because dividing a decimal-GB budget by a KiB-per-token cost is how you end up 7% off without noticing.
For tighter control, recent vLLM versions expose --kv-cache-memory-bytes, which sets the cache size explicitly instead of deriving it automatically, and overrides --gpu-memory-utilization entirely once set. Most deployments never touch this and just trust the automatic budget. It earns its keep when several engines share one card and each needs a guaranteed slice rather than whatever’s left over.
How Many Requests Can I Actually Serve?
Two different questions hide inside “how many users can this GPU handle,” and conflating them is where most sizing mistakes come from.
Concurrency is a Memory Question
How many sequences can run at once is pure division once you know the KV budget, since the budget is a fixed pool and every token costs the same fixed number of bytes no matter which sequence it belongs to:
$$\text{max concurrent tokens} = \frac{\text{KV cache budget}}{\text{bytes per token}}$$ $$\frac{52 \text{ GiB}}{128 \text{ KiB}} = 425{,}984 \text{ tokens}$$Divide that by how many tokens an average conversation runs, prompt plus generated output combined. At 2,000 tokens a conversation, that’s roughly 200 concurrent sequences. Push the average to 8,000 tokens and the same 52 GiB only holds about 50. Same GPU, same model, wildly different capacity, because what actually costs memory is tokens in flight, not requests in flight.
Capacity Falls Off a Cliff, Not a Slope
Those two numbers are points on a curve, and the shape of that curve is worth internalizing, because the intuition most people bring to it is wrong. Concurrency and context length are inversely proportional, so plotting one against the other gives a hyperbola, not a line.
LLAMA 3.1 8BThe practical consequence is that the cost of context isn’t constant, it scales with the square of where you already are. Differentiate the capacity equation and the sensitivity term goes as $1/T^2$, i.e., at a 2,000-token average, every extra 100 tokens of context costs you about 10 concurrent sequences. At 8,000, the same 100 tokens costs about 0.7. That’s a fifteen-fold difference in what an identical change does to your capacity, depending entirely on which part of the curve you’re sitting on.
That asymmetry shows up in a place nobody instruments. Add 500 tokens of system prompt to every request, a few more few-shot examples, a longer tool schema, and at a 2,000-token average you’ve just given up 20% of your concurrency, 213 sequences down to 170. Make the same edit on a deployment averaging 8,000 tokens and it costs you 6%. The prompt change looks identical in code review. Its capacity bill differs by more than 3x.
Read the curve the other way and it also explains what FP8 actually buys you. Halving bytes-per-token doesn’t bend the shape, it just shifts the whole curve up by exactly 2x, which is the same thing as sliding it right, i.e., FP8 at an 8,000-token average holds precisely what FP16 holds at 4,000. If you’re deep in the flat tail, though, neither trimming context nor quantizing the cache moves the needle much in absolute terms. Past roughly 8,000 tokens the curve is close enough to flat that more hardware, not more tuning, is the honest answer.
Throughput is a Different Question, and Memory Alone Can’t Answer It
Requests per second isn’t something the memory math answers directly. A sequence holds its slice of the cache for as long as it takes to finish, and that duration depends on output length, which varies by request. The memory calculation gives you a ceiling on concurrency, and you find sustainable throughput by testing against that ceiling. vLLM ships a benchmarking tool for exactly this:
1vllm bench serve \2 --model meta-llama/Llama-3.1-8B-Instruct \3 --num-prompts 1000 \4 --request-rate 20
--num-prompts sets total requests sent. --request-rate sets requests per second attempted. Point this at your real deployment with a realistic prompt and output length distribution, and you get the requests-per-second figure the memory math can’t hand you on its own.
Continuous Batching: Why “200 Users” Doesn’t Mean 200 Fixed Slots
Picturing 200 concurrent users as 200 dedicated slots running in lockstep, like 200 parallel threads, is a natural mental model, and it’s wrong. vLLM doesn’t hold a fixed batch of requests until they all finish before starting the next one.
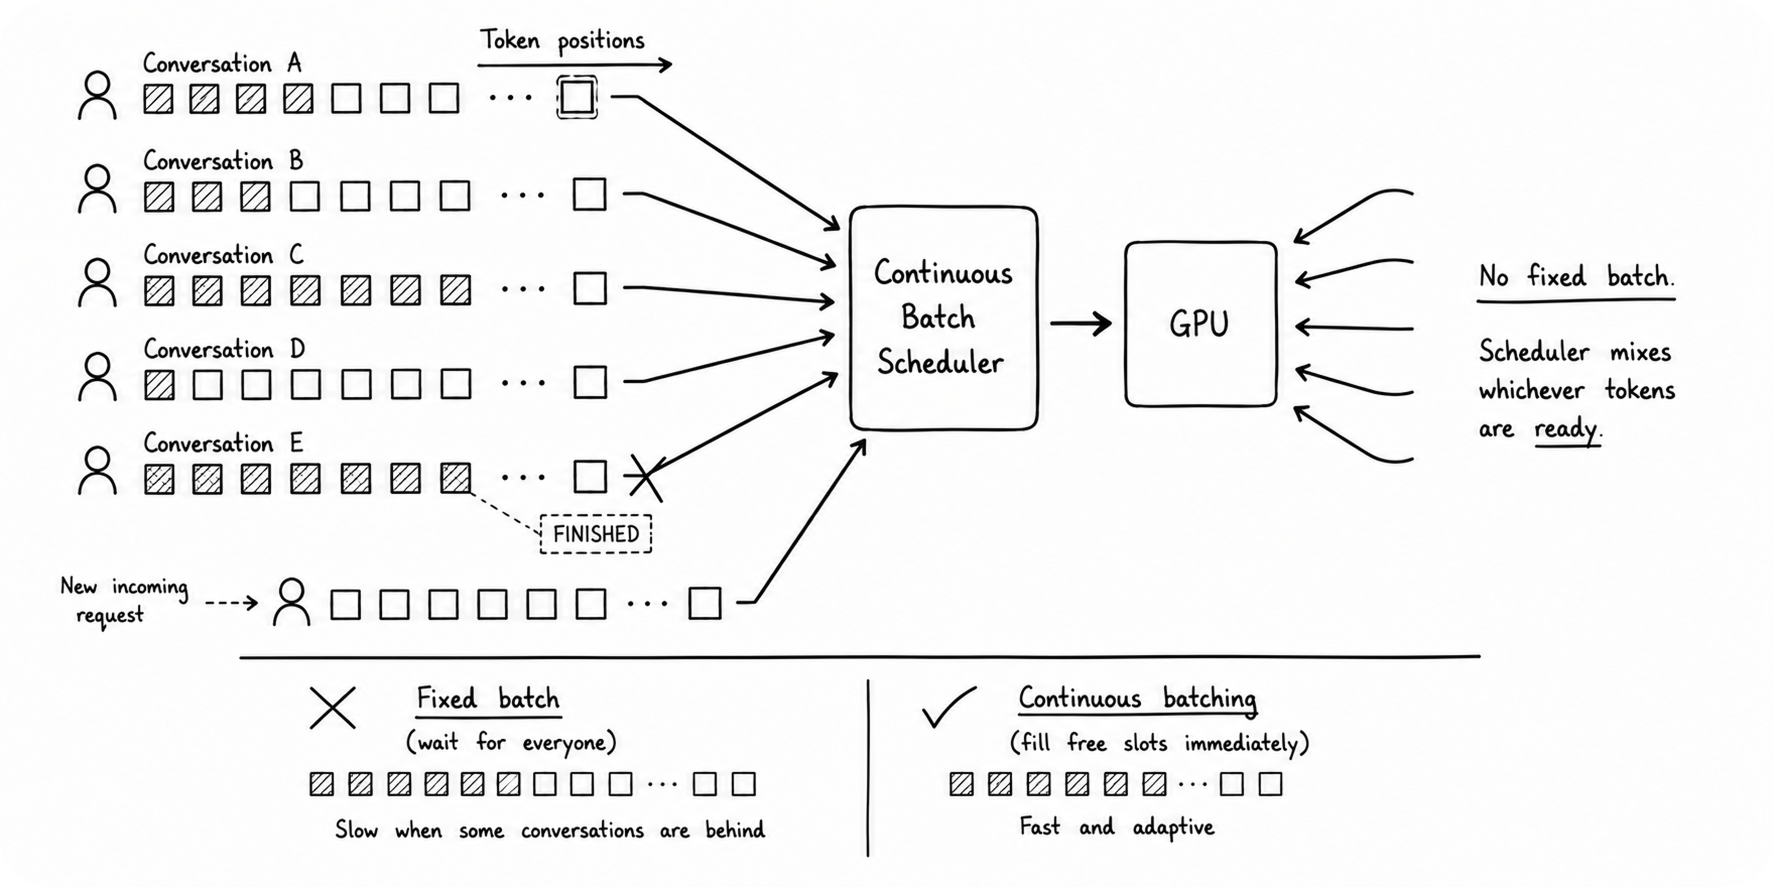
At every decode step the scheduler mixes together whatever tokens are due next across every active sequence, some finishing, some just starting, some in the middle, and runs all of them through the model in one pass. A sequence that finishes frees its slot immediately, and a new request can join on the very next step instead of waiting out a batch cycle. That’s what lets one GPU keep hundreds of independent conversations moving at once without burning compute on padding or idle slots. The idea is iteration-level scheduling, introduced by Orca, which returns control to the scheduler after every single decode step rather than after a whole request finishes.[7] Nearly every modern serving engine, vLLM included, is built on some version of it.
The 200-user figure describes how many sequences can hold KV cache space at the same time. It isn’t a batch shape the scheduler is locked into.
A Sequence Isn’t Always the Same Thing as a User
The KV budget math is really counting active sequences, not users, and that distinction matters more than it sounds. Parallel sampling, multiple candidate completions off one prompt, beam search, concurrent tool calls inside a single conversation, all of these spin up more than one sequence for the same user. “200 concurrent users” is shorthand for “200 concurrent sequences,” and if your product generates several sequences per user turn, real user capacity sits below the raw sequence count.
When Requests Share a Prefix, They Can Share Cache Too
Everything so far assumes each sequence needs its own independent KV cache, which is usually true but not always. When a pile of requests share an identical prefix, a common system prompt, a shared set of few-shot examples, the same long document, engines like vLLM can detect the overlap and reuse the already-computed cache for that shared span instead of recomputing it per request. That’s prefix caching, generalised by SGLang into RadixAttention, which keeps live KV blocks in a radix tree so prefix reuse becomes a lookup rather than a special case for one shared system prompt,[14] and on workloads with a lot of shared context it changes the effective capacity math above by a wide margin. It’s a big enough topic to earn its own piece, which is where the next part of this series picks up.
Putting the Numbers Together
Before moving into the tuning flags, here’s the whole chain from raw hardware to concurrent users in one place:
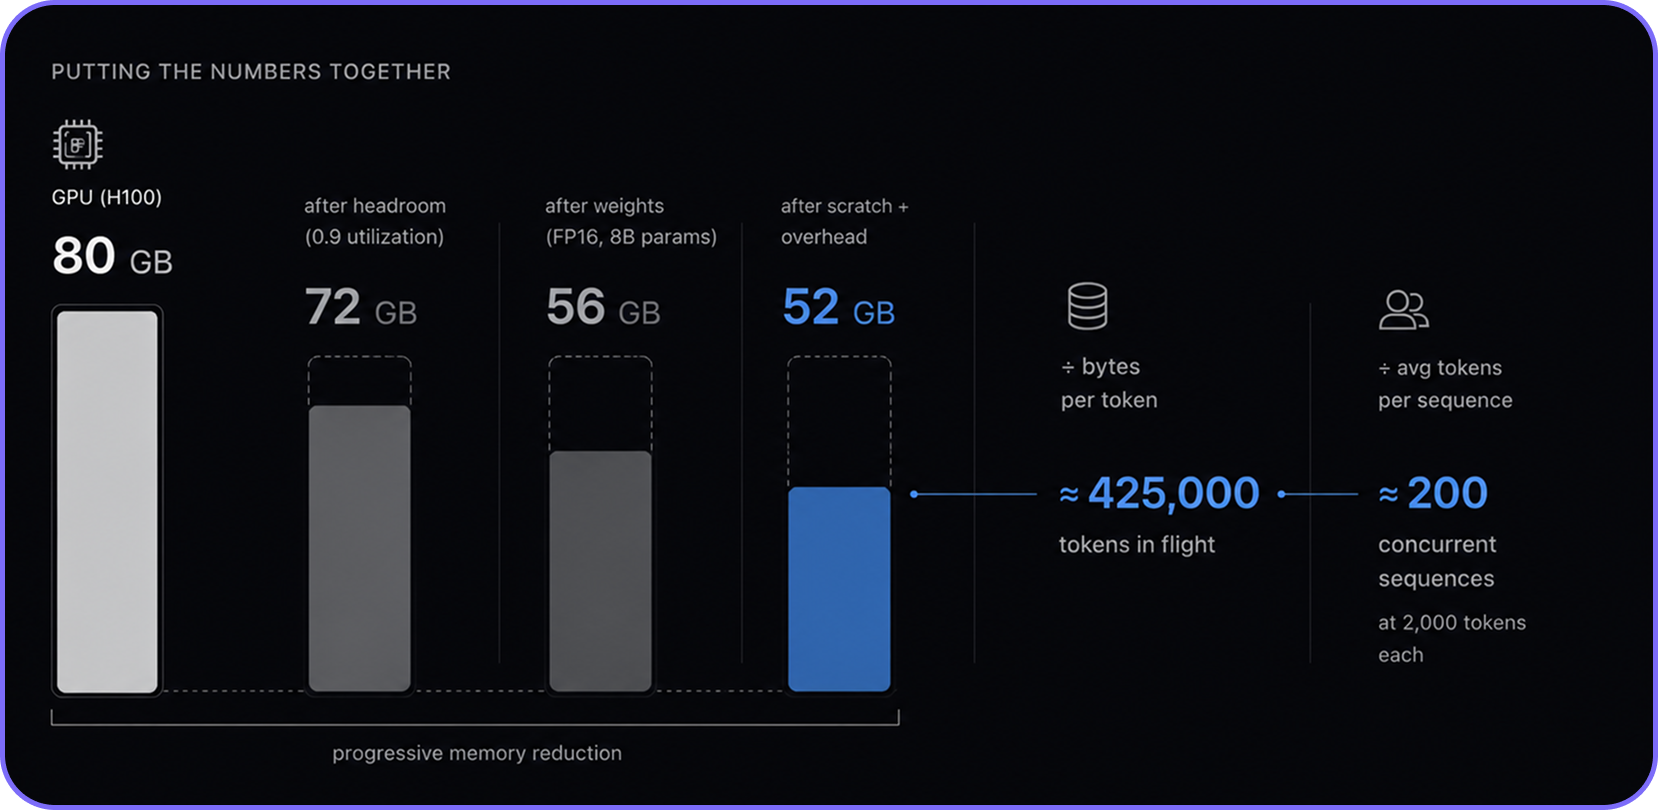
NoteEvery number in that chain traces back to something already covered - be it hardware, a config flag, an architecture detail, or a traffic assumption. Move any one of them and the concurrency figure moves with it.
The Memory Dials: What Each Setting Actually Trades
Every memory-related flag in vLLM is a dial on that same 52 GiB pool.[5] Which direction each dial pushes is most of what you need to actually operate this thing.
| Flag | What it controls | Effect of raising it | When to use it |
|---|---|---|---|
--gpu-memory-utilization | Ceiling on total GPU memory vLLM may use | More room for KV cache and more concurrent users, but less spare headroom for memory spikes | 0.90 to 0.95 on a dedicated GPU with no other processes sharing it |
--max-model-len | Longest context any single request can use | A larger per-sequence worst case. vLLM checks this fits at startup and refuses to start if it can’t | Set close to your real traffic’s maximum, not the model’s theoretical context window, so you’re not reserving room you’ll never use |
--kv-cache-dtype fp8 | Precision the KV cache itself is stored in | Roughly doubles how many tokens fit in the same memory | Usually the single highest-leverage setting for raising concurrency, worth trying before adding hardware |
--max-num-seqs | Hard cap on concurrently running sequences | Lets more requests run at once, until memory runs out first | Raise it when your KV budget has spare room at typical context lengths that this cap is limiting unnecessarily |
--max-num-batched-tokens | Token budget the scheduler can process in a single step | Higher values favor throughput and shorter TTFT for queued prefills. Lower values favor steadier inter-token latency | Tune based on whether your workload is latency-sensitive or throughput-sensitive, there’s a genuine trade-off here |
--kv-cache-memory-bytes | Explicit KV cache size, overrides the automatic calculation | Direct control, bypasses the weights-minus-overhead estimate entirely | Multi-engine deployments on one GPU where each engine needs a guaranteed share |
--enforce-eager | Whether CUDA graphs get captured at all | Not a value you raise, a switch you flip. Turning it on skips graph capture and returns that scratch memory to the KV budget, at a real cost in decode speed | A last resort when you’re a gigabyte or two short of fitting, or when debugging. Prefer trimming --cuda-graph-sizes first, it gives back some of the same memory without surrendering graphs entirely |
Reading that table one row at a time hides what happens when you pull two dials at once. The two levers people reach for first, INT4 weights and --kv-cache-dtype fp8, draw from different pools, so their memory gains stack cleanly. What they cost doesn’t land in the same place.
LLAMA 3.1 8BThe baseline and the both-levers shape are close to mirror images, and that’s the honest summary of this section. Baseline is the configuration that runs on any card, needs no flags, and ships the checkpoint you already downloaded, and it’s also the one sitting on about 3 GiB of slack at 200 concurrent users, which is roughly where the OOM pages in the field guide below come from. Pull both levers and the same H100 holds 524 sequences at that context length with room to spare, paid for in numerical fidelity, in an H100-or-newer requirement for FP8, and in a quantized checkpoint you now have to produce and re-evaluate yourself. Neither end is right by default. Which one you want depends on whether your binding constraint is the card or the eval set.
Why FP8 KV Cache Roughly Doubles Capacity
The mechanism is plain arithmetic. Every element costs 2 bytes in FP16 and 1 in FP8, in either the E4M3 or E5M2 encoding,[11] so storing the same token count costs half the memory, and the same 52 GiB budget now holds twice as many tokens. Attention tolerates this precision drop reasonably well, in part because quantization error on the keys passes through a softmax that squashes small perturbations before they reach the output, so quality loss tends to be modest for most production workloads. Check it against your own eval set anyway, particularly for anything leaning on precise numerical reasoning, rather than taking that on faith.
When It Breaks: The Field Guide
You’ll run into these eventually. Here’s how to read them.
| Symptom | What’s actually happening | What to try |
|---|---|---|
| Server won’t start, logs mention no available memory for cache blocks | Weights and overhead consumed the entire utilization budget, leaving no room for even one request at max-model-len | Lower --max-model-len, or turn on --kv-cache-dtype fp8 to shrink the per-token cost |
| Crashes under load with an out-of-memory error | A traffic spike pushed usage past the headroom left below your utilization ceiling | Lower --gpu-memory-utilization to leave more slack, or scale out |
| Throughput drops sharply, logs show preemption warnings | More sequences were admitted than the KV cache can simultaneously hold, so vLLM is preempting some to free space for others | Roughly in this order: raise --gpu-memory-utilization first if you have headroom, then lower --max-num-seqs or --max-num-batched-tokens to admit fewer concurrent sequences, then consider increasing tensor parallelism or pipeline parallelism to spread weights across more GPUs and free up more room per device |
| Slow time-to-first-token, requests appear to pile up | Long prompts are monopolizing prefill compute ahead of shorter, quicker requests | In current vLLM (V1), chunked prefill is already enabled by default whenever possible. Check whether --max-num-batched-tokens is set too low for your prompt lengths rather than assuming chunked prefill needs to be turned on manually, that flag is mostly a V0-era concern now |
The chunked prefill in that last row is worth understanding rather than just toggling. It comes from Sarathi-Serve, which splits a long prefill into fixed-size chunks and piggybacks in-flight decodes onto each one, so a single 30,000-token prompt can no longer stall every streaming response behind it for the duration of its forward pass.[10] --max-num-batched-tokens is the knob that sets that chunk size, which is why setting it too low starves prefill and setting it too high reintroduces the stall it was meant to remove.
Preemption specifically deserves more than a reflex fix. It happens because the scheduler let in more sequences than the cache can hold simultaneously, and vLLM’s answer is to evict some and recompute them later rather than crash outright. Recomputation isn’t free, so frequent preemption quietly taxes latency and throughput even while the server looks healthy from the outside. vLLM exposes preemption counts through its Prometheus metrics, and that number is what to watch if you suspect this is happening, rather than waiting for someone to notice slower responses first.[6]
The Sizing Checklist
Before any deploy, work through these in order:
- Work out bytes-per-token for your exact model. Use the number of key-value heads, not total attention heads, take
head_dimfromconfig.jsonrather than deriving it, and confirm your architecture uses plain full attention rather than MLA or sliding-window layers. - Work out your KV cache budget: GPU memory times utilization, minus weights, minus overhead.
- Divide by your busiest realistic average context length, prompt plus completion combined, to estimate concurrent sequences.
- Load test with
vllm bench serveagainst that estimate to find the real requests-per-second you can sustain. Don’t treat the memory ceiling as a throughput number. - Decide your fixes ahead of time. FP8 KV cache for more room, a lower utilization ceiling for more stability, tensor parallelism if you need both.
Common Mistakes
Two hundred concurrent users means two hundred fixed execution slots. Not with continuous batching in the picture. Every decode step mixes tokens from many sequences together, and the 200 figure is a ceiling on how many sequences can hold cache space at once, not a batch shape the scheduler is locked into.
Quantizing weights to AWQ or INT4 is sometimes assumed to shrink the KV cache along with them. It doesn’t, not unless KV cache quantization gets turned on separately. Weight precision and cache precision are independent settings, and shrinking weights only frees memory that then flows into the cache budget. The cache itself keeps whatever precision --kv-cache-dtype specifies.
The bytes-per-token formula works for any model. Only for standard multi-head and grouped-query attention. DeepSeek’s Multi-head Latent Attention compresses the KV representation into a latent vector instead of full per-head keys and values, and the arithmetic above simply doesn’t apply there. Sliding-window models break it from the other side, capping per-sequence growth at the window rather than letting it climb with context length.
Speculative decoding is sometimes pitched as a way to squeeze more concurrent users out of a GPU. It isn’t.[15] It speeds up how fast tokens come out of a sequence that’s already running, using a small draft model to propose tokens the larger model verifies in parallel, but it doesn’t touch how much KV cache that sequence needs while it’s active. Throughput optimization and concurrency optimization are not the same lever.
One user, one KV cache slot, is the assumption until parallel sampling, beam search, or concurrent tool calls enter the picture. Any of those can spin up several sequences under a single user’s request, and each sequence carries its own KV footprint regardless of how many humans are actually attached to it.
Production Notes
A few things the math above doesn’t cover, but that matter once real traffic shows up.
Size against a realistic worst case, not just an average. The concurrency estimate leans on an average context length, and production traffic is never that tidy. A burst of unusually long requests can eat the KV budget faster than the average implies, triggering preemption even when the average-case math looked comfortable. Sizing against something closer to your p95 context length, not the mean, leaves headroom that actually holds up.
Watch KV cache utilization, not raw GPU memory usage. A card that isn’t idle doesn’t tell you how close you are to the preemption threshold. vLLM’s Prometheus metrics expose cache usage percentage, running and waiting request counts, and cumulative preemption counts, and those are the numbers to alert on rather than whatever the driver reports.
TipRe-run this math whenever something upstream changes. A GPU swap, a model upgrade, a new
--max-model-len, or even a product change that quietly encourages longer conversations, all of these move the inputs into this calculation. Capacity planning here isn’t a one-time exercise done at launch and forgotten. Recheck it against real production request-length distributions periodically.

Scaling past one GPU is a different decision than tuning one GPU. Tensor parallelism (TP) shards weights across GPUs and, in vLLM’s implementation, also shards attention heads, including KV heads, so the per-GPU KV cache cost drops roughly in proportion to the TP degree as well, not just the weight footprint. A model with 8 KV heads split across a TP degree of 4 gives each GPU roughly 2 KV heads’ worth of cache to hold, at the cost of cross-GPU synchronization on every layer. That only holds while the TP degree divides into the KV head count, though. GQA leaves most models with very few KV heads, and once TP exceeds that number there’s nothing left to shard, so vLLM replicates the KV heads across ranks instead and the per-GPU cache cost stops falling. On Llama 3.1 8B’s 8 KV heads, TP 8 is where the savings stop, where as TP 16 halves the weights again and buys you no KV cache room at all. The exact split can also look different for mixture-of-experts architectures, so treat that ratio as a first approximation and check your engine’s own startup logs for the number it actually computed. Pipeline parallelism spreads layers instead, trading some added latency for headroom without that synchronization cost. Past that, horizontal scaling with several vLLM instances behind a load balancer is usually easier to reason about than pushing one instance further than its hardware comfortably allows.
CautionLeave real slack on shared infrastructure. If the GPU isn’t dedicated to this one vLLM instance, don’t push
--gpu-memory-utilizationto the edge of what the math technically allows. Reserve room for spikes the automatic scratch space estimate never saw coming.
Summary
Serving an open model was never the hard part. Knowing exactly how many concurrent conversations one GPU can hold, and which setting to reach for the moment it can’t hold any more, is what separates a demo from something you’d put a pager rotation behind.
Model weights are a fixed, one-time cost. The KV cache is a variable cost that grows with every active sequence. Prefill fills it for the prompt, decode fills it for everything generated after. Once you know your bytes-per-token number and your KV cache budget, you know your concurrency ceiling, and every flag after that, gpu-memory-utilization, max-model-len, kv-cache-dtype, max-num-seqs, max-num-batched-tokens, is a dial on that same budget, trading memory for throughput, stability, or latency in a specific, predictable direction. Continuous batching is what turns that ceiling into hundreds of conversations moving forward together, instead of 200 requests waiting their turn in a line.
That’s the whole first half of running vLLM well, i.e., — knowing what fits. The second half is what to do once it fits, and that calls for a different set of levers entirely, the kind that make a correctly sized deployment a genuinely fast one. Stay tuned for more.
Thanks for reading. Comments and corrections are welcome.
P.S.: No tokens were harmed in writing this.
References
- [1]
Woosuk Kwon, Zhuohan Li, Siyuan Zhuang, Ying Sheng, Lianmin Zheng, Cody Hao Yu, Joseph E. Gonzalez, Hao Zhang, and Ion Stoica, “Efficient Memory Management for Large Language Model Serving with PagedAttention”, SOSP (2023).
- [2]
Joshua Ainslie, James Lee-Thorp, Michiel de Jong, Yury Zemlyanskiy, Federico Lebrón, and Sumit Sanghai, “GQA: Training Generalized Multi-Query Transformer Models from Multi-Head Checkpoints” (2023).
- [3]
DeepSeek-AI, “DeepSeek-V2: A Strong, Economical, and Efficient Mixture-of-Experts Language Model” (2024).
- [4]
Llama Team, AI @ Meta, “The Llama 3 Herd of Models” (2024).
- [5]
vLLM Project, “Engine Arguments”, vLLM Documentation.
- [6]
vLLM Project, “Optimization and Tuning”, vLLM Documentation.
- [7]
Gyeong-In Yu, Joo Seong Jeong, Geon-Woo Kim, Soojeong Kim, and Byung-Gon Chun, “Orca: A Distributed Serving System for Transformer-Based Generative Models”, OSDI (2022).
- [8]
Reiner Pope, Sholto Douglas, Aakanksha Chowdhery, Jacob Devlin, James Bradbury, Anselm Levskaya, Jonathan Heek, Kefan Xiao, Shivani Agrawal, and Jeff Dean, “Efficiently Scaling Transformer Inference” (2022).
- [9]
Noam Shazeer, “Fast Transformer Decoding: One Write-Head is All You Need” (2019).
- [10]
Amey Agrawal, Nitin Kedia, Ashish Panwar, Jayashree Mohan, Nipun Kwatra, Bhargav S. Gulavani, Alexey Tumanov, and Ramachandran Ramjee, “Taming Throughput-Latency Tradeoff in LLM Inference with Sarathi-Serve”, OSDI (2024).
- [11]
Paulius Micikevicius, Dusan Stosic, Neil Burgess, et al., “FP8 Formats for Deep Learning” (2022).
- [12]
Ji Lin, Jiaming Tang, Haotian Tang, Shang Yang, Wei-Ming Chen, Wei-Chen Wang, Guangxuan Xiao, Xingyu Dang, Chuang Gan, and Song Han, “AWQ: Activation-aware Weight Quantization for LLM Compression and Acceleration”, MLSys (2024).
- [13]
Elias Frantar, Saleh Ashkboos, Torsten Hoefler, and Dan Alistarh, “GPTQ: Accurate Post-Training Quantization for Generative Pre-trained Transformers”, ICLR (2023).
- [14]
Lianmin Zheng, Liangsheng Yin, Zhiqiang Xie, Chuyue Sun, Jeff Huang, Cody Hao Yu, Shiyi Cao, Christos Kozyrakis, Ion Stoica, Joseph E. Gonzalez, Clark Barrett, and Ying Sheng, “SGLang: Efficient Execution of Structured Language Model Programs”, NeurIPS (2024).
- [15]
Yaniv Leviathan, Matan Kalman, and Yossi Matias, “Fast Inference from Transformers via Speculative Decoding”, ICML (2023).
- [16]
Gemma Team, Google DeepMind, “Gemma 3 Technical Report” (2025).


